Blah, Cloud.

Adventures in architectures

  • Twitter
  • GitHub
  • Home
  • Blog
  • Kubernetes on vSphere
  • Multi-tenant IaaS Networking
  • Me
    • About
    • CV
    • Contact
Home » Blog » Hardware » Syslogd on FortiOS 5.0.4

Syslogd on FortiOS 5.0.4

18/09/2013 by Myles Gray 13 Comments

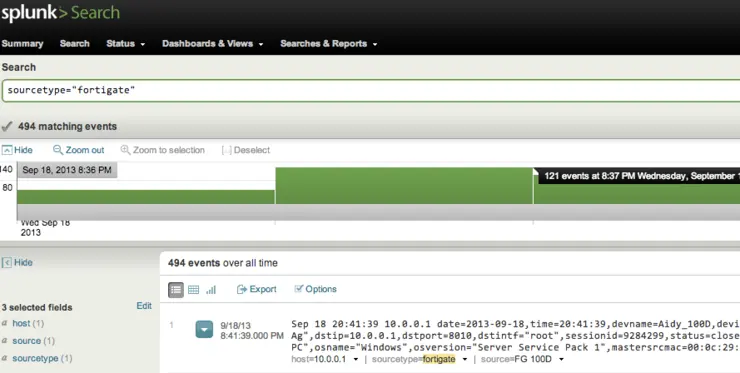
Again, Fortigate’s documentation falls down at the simplest of things, this time, syslogging – To get your Fortigate to log to a syslogger (like Kiwi/Splunk) you’ll need to go in via the CLI as they have removed this option from the GUI as of FortiOS v5.0.

Splunk Fortigate Syslogd

Log in via shell and enter the following:

config log syslogd setting
    set status enable
    set server [ip.or.dns-name.here]
end

I have seen where people say you need to explicitly:

set port 514 or set facility local7 but these are defaults and implied.

You can set up multiple syslog server locations by simply changing the first line to config log [syslog2|syslog3] setting and filling in the details for the other syslog servers.

Why not follow @mylesagray on Twitter for more like this!

Show some love:

  • Reddit
  • Twitter
  • Pocket
  • LinkedIn
  • Email
  • Telegram

Similar things I've written

Filed Under: Hardware, Infrastructure Tagged With: fortigate, splunk, syslogd

About Myles Gray

Hi! I'm Myles, and I'm a Dev Advocate at VMware. Focused primarily on content generation, product enablement and feedback from customers and field to engineering.

Comments

  1. shiv singh says

    20/11/2013 at 11:50

    FortiOS v5.0 but command used very affectable…gui form user friendly….what is new version fortios …..

    Reply
  2. Justin Hobson says

    05/12/2013 at 03:23

    Does Splunk with Fortinet app support FortiOS 5.0.5? Trying to run this and not having great success, searching online and no other sites believe Splunk works with v5.0.x also ?

    Reply
  3. Myles Gray says

    05/12/2013 at 12:00

    Splunk does work with v5.0.4 at least (it works as a syslog server and the reporting works to SOME extent) not sure on 5.0.5 we haven’t worked on this much more since 5.0.4 as we’ve had more important projects.

    I will check this out though, if it doesn’t work it shouldn’t take too much work out what’s broken in the Fortinet app (likely column name changes etc).

    Reply
  4. Jack says

    03/04/2014 at 10:20

    Dear Myles Gray,
    I have a Fortigate 100D with FortiOS 5.06 , this is my setting
    config log syslogd setting
    set status enable
    set server “192.168.7.4”
    set reliable disable
    set port 515
    set csv disable
    set facility alert
    set source-ip 192.168.9.2
    end
    I have a Splunk server on server 192.168.7.4 listening on port 515 TCP, my switchs can forward log to it normally, but I cannot get Fortigate works. Splunk server doesn’t receive any logs from Fortigate

    Reply
    • Myles Gray says

      17/04/2014 at 14:40

      Jack, we actually have moved on from Splunk to trialling a Logstash/ElasticSearch/Kibana stack as it is:

      a) free
      b) easy to configure and get the data we want

      I’ll be putting a post up about this soon.

      You’re sure you’ve enabled 515 TCP on your iptables? Did you check the output of `netstat -tlp` on your Splunk box to see if the port is listed?

      Reply
      • Raul Recinos says

        12/08/2014 at 22:30

        Dear Myles, have any tutorial or can help me set Logstash / ElasticSearch / Kibana, to store / display my Fortigate logs?

        Reply
  5. TT says

    01/05/2014 at 22:45

    Can you share the config file of logstash for fortigate

    Reply
    • Myles Gray says

      06/05/2014 at 07:15

      I’ll put this info up soon once we have it operating how we expect and i’ll do a full guide.

      Reply
      • Edzilla says

        22/05/2014 at 14:35

        I’d be very interested as well.
        We’re currently working on a logstash+elasticsearch+kibana setup, but not getting really anywhere yet.

        Reply
      • Vedat Nommaz says

        01/09/2015 at 08:12

        Hi Myles, have you posted this guide yet?

        Reply
        • Myles Gray says

          01/09/2015 at 08:17

          It never happened Vedat unfortunately

          Reply
  6. David Fabry says

    10/06/2014 at 23:01

    Sounds all wonderful but the information is SO scarce. I just sopped at logstash+elasticsearch+Kibana and I’m on a loop tryng to figure it out. I’m very interested in the setup too !!

    Reply
  7. herringchoker says

    02/07/2014 at 02:36

    To set the level of messages you want to see:

    config log syslogd filter
    set severity warning

    Reply

Leave a Reply Cancel reply

This site uses Akismet to reduce spam. Learn how your comment data is processed.

Myles Gray

Hi! I'm Myles, and I'm a Dev Advocate at VMware. Focused primarily on content generation, product enablement and feedback from customers and field to engineering. Read More…

Categories

Tags

active directory authentication CBT cisco datastore dell design esxi fortigate iscsi jumbo frame kubernetes lab linux load-balancing lun md3000i mtu networking NginX nic nsx openSUSE osx pxe readynas san sdelete serial teaming ubuntu vcenter vcloud director vcsa vexpert video VIRL vmdk vmfs vmware vsan vsphere vsphere 6 vsphere beta windows

Subscribe to Blog via Email

Copyright © 2021 · News Pro Theme on Genesis Framework · WordPress · Log in

loading Cancel
Post was not sent - check your email addresses!
Email check failed, please try again
Sorry, your blog cannot share posts by email.